LogMAR VA charts
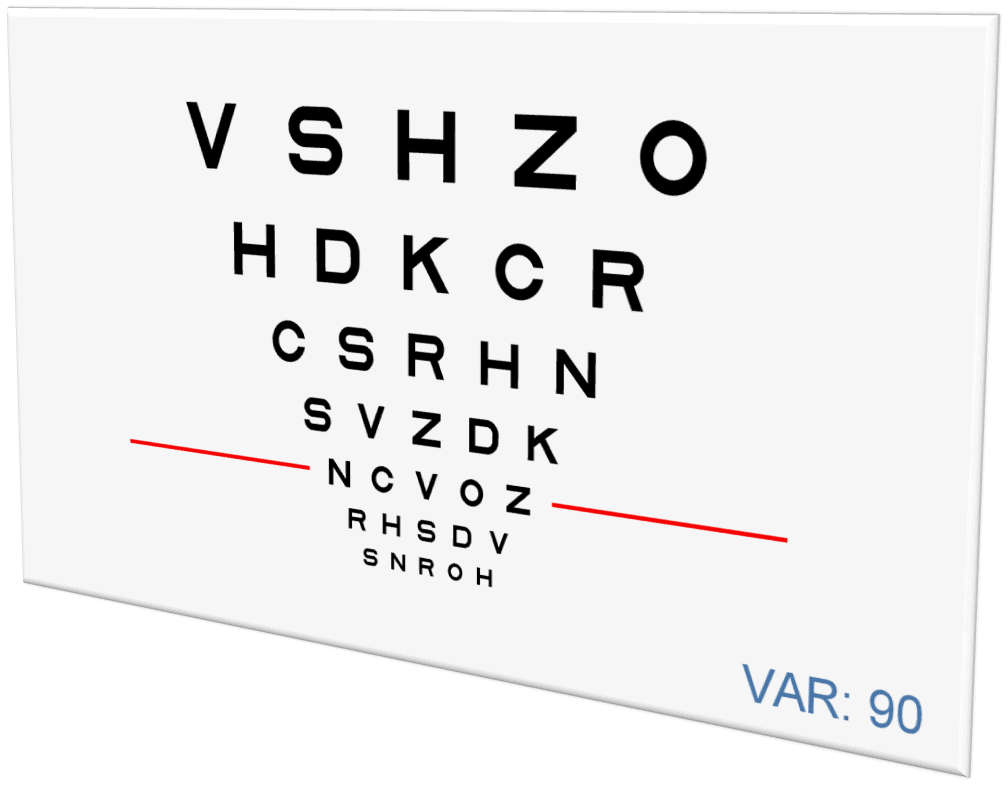
Some of the characteristic features of the standard VA charts include:
- Regular and geometric progression of letter size between a row and the next (in steps of 0.1 log units).
- Letters of similar legibility, and balanced distribution of letter legibility in and between each row.
- Equal number of letters on each row (five).
- Space uniformity between letters and also between rows, to achieve homogeneous contour interaction.
- Letter by letter VA scoring system.
The VA task should be essentially the same at each size level on the chart.

This is especially relevant when comparing values taken in clinical practices (where VA is typically measured with standard Snellen charts) with those from clinical research trials (which typically measure VA using logMAR charts).10 These discrepancies are particularly significant for the prescription and monitoring of high cost treatments for exudative AMD as well as for other retinal diseases.
Implementing standardized visual acuity systems when testing preschool and young children is also needed in order to enhance testability and reliability. Similar to adults, logMAR VA charts with symmetrical letters are being introduced into strabismus and pediatric services because of the need for accurate and reproducible VA measurements, features of testing that all practitioners would appreciate.
LogMAR VA charts are considered nowadays the gold standard for VA1 in both clinical and research settings,11 and should therefore be adopted in all clinical settings for vision care.
Why then has logMAR VA charts not yet been universally adopted?

Despite logMAR VA charts being shown to be more accurate and reliable; the actual implementation of standardized VA charts in published studies has been questioned.12 Furthermore, logMAR VA charts are not as widely available as Snellen charts internationally in clinical practice.13,14
There are several reasons to explain why standardized VA measurement with logMAR system has failed to be the method of choice for the majority of clinicians in everyday practice:
- The first practical difficulty comes with the testing room size, as former ETDRS charts were constructed to be viewed at a fixed distance of 4 m, a distance that many testing rooms cannot accommodate.
- It has also been pointed out that logMAR charts are more time-consuming and difficult to understand than Snellen charts. This translates into increased measurement time15,16,17 which is not always well accepted by both patients and practitioners. Another negative aspect is the unfamiliar and counterintuitive logMAR VA scoring system, which complicates the calculation of the final VA score for a given patient.
- Refraction using a logMAR chart has been criticized for being time-consuming and frustrating. The crowding phenomenon in logMAR charts makes it more difficult to the point that often patients become easily lost and end up re-reading the chart to locate the line of letters they were requested to read.
- Finally, because Snellen charts have been prevalent for many years, and are therefore well ingrained in common visual testing, many practitioners are not motivated to change.13
All these reasons may explain why widespread adoption of logMAR charts has not yet taken place internationally.18,19 However, new technology can combine the advantages of the LogMAR design without the drawbacks of a printed chart, allowing more flexible, streamlined and standardized testing that will appeal to most practitioners. These advantages can potentially enhance uptake of standardized VA measurement in routine clinical practice, as is urgently needed.13,20
Optonet Vision Unit
Optonet has developed a computerized system for visual testing that incorporates standardized VA tests with functions that have been designed to overcome the shortcomings explained above and to promote and ease the transition from Snellen to logMAR VA charts in all clinical settings. This is one of the main reason of the Optonet Project.
If you want to easily measure visual acuity with standardised logMAR quality – either in your clinic or remotely – register now with the Optonet Vision Unit and get immediate access to its digital charts.

1. International Council of Ophthalmology (ICO). Visual acuity measurement standard. Kos, Greece: ICO; 1984. Available at: http://www.icoph.org/dynamic/attachments/resources/icovisualacuity1984.pdf. Accessed March 20, 2011.
2. National Research Council Committee on Vision. Recommended standard procedures for the clinical measurement and specification of visual acuity. Adv. Ophthalmol. Fortschritte Augenheilkd. Prog. En Ophtalmol. 41, 103–48 (1980).
3. World Health Organization. Consultation on development of standards for characterization of vision loss and visual functioning. Geneva, Switzerland: WHO. Available at: http://whqlibdoc.who.int/hq/2003/WHO_PBL_03.91.pdf. (2003).
4. Bailey, I. L. & Lovie, J. E. New design principles for visual acuity letter charts. Am. J. Optom. Physiol. Opt. 53, 740–5 (1976).
5. Ferris, F. L., 3rd, Kassoff, A., Bresnick, G. H. & Bailey, I. New visual acuity charts for clinical research. Am. J. Ophthalmol. 94, 91–96 (1982).
6. Ferris, F. L., Freidlin, V., Kassoff, A., Green, S. B. & Milton, R. C. Relative letter and position difficulty on visual acuity charts from the Early Treatment Diabetic Retinopathy Study. Am. J. Ophthalmol. 116, 735–740 (1993).
7. Gibson, R. A. & Sanderson, H. F. Observer variation in ophthalmology. Br. J. Ophthalmol. 64, 457–60 (1980).
8. Lovie-Kitchin, J. E. Validity and reliability of visual acuity measurements. Ophthalmic Physiol. Opt. J. Br. Coll. Ophthalmic Opt. Optom. 8, 363–370 (1988).
9. McGraw, P. V., Winn, B., Gray, L. S. & Elliott, D. B. Improving the reliability of visual acuity measures in young children. Ophthalmic Physiol. Opt. J. Br. Coll. Ophthalmic Opt. Optom. 20, 173–84 (2000).
10. Falkenstein, I. A. et al. Comparison of visual acuity in macular degeneration patients measured with snellen and early treatment diabetic retinopathy study charts. Ophthalmology 115, 319–323 (2008).
11. Ferris, F. L. & Bailey, I. Standardizing the measurement of visual acuity for clinical research studies: Guidelines from the Eye Care Technology Forum. Ophthalmology 103, 181–2 (1996).
12. Williams, M. a, Moutray, T. N. & Jackson, a J. Uniformity of visual acuity measures in published studies. Invest. Ophthalmol. Vis. Sci. 49, 4321–7 (2008).
13. Hussain, B., Saleh, G. M., Sivaprasad, S. & Hammond, C. J. Changing from Snellen to LogMAR: debate or delay? Clin. Experiment. Ophthalmol. 34, 6–8 (2006).
14. Kaiser, P. K. Prospective evaluation of visual acuity assessment: a comparison of snellen versus ETDRS charts in clinical practice (An AOS Thesis). Trans. Am. Ophthalmol. Soc. 107, 311–324 (2009).
15. Rosser, D. A., Laidlaw, D. A. & Murdoch, I. E. The development of a ‘reduced logMAR’ visual acuity chart for use in routine clinical practice. Br. J. Ophthalmol. 85, 432–436 (2001).
16. Laidlaw, D. a. H., Abbott, A. & Rosser, D. A. Development of a clinically feasible logMAR alternative to the Snellen chart: performance of the ‘compact reduced logMAR’ visual acuity chart in amblyopic children. Br. J. Ophthalmol. 87, 1232–1234 (2003).
17. Tewari, H. K., Kori, V., Sony, P., Venkatesh, P. & Garg, S. Snellen chart may be preferable over early treatment diabetic retinopathy study charts for rapid visual acuity assessment. Indian J. Ophthalmol. 54, 214 (2006).
18. Sprague, J. B., Stock, L. A., Connett, J. & Bromberg, J. Study of chart designs and optotypes for preschool vision screening–I. Comparability of chart designs. J. Pediatr. Ophthalmol. Strabismus 26, 189–197 (1989).
19. Camparini, M., Cassinari, P., Ferrigno, L. & Macaluso, C. ETDRS-fast: implementing psychophysical adaptive methods to standardized visual acuity measurement with ETDRS charts. Invest. Ophthalmol. Vis. Sci. 42, 1226–1231 (2001).
20. Rosenfield, M. It’s time to stop using 20/20 in the clinic. Optom. Vis. Sci. Off. Publ. Am. Acad. Optom. 89, e27 (2012).
Free Trial
Activate your Optonet Vision Unit today and discover its capabilities firsthand.
