
Optonet Vision Unit Documentation
Please note that this User Guide is being currently updated; new sections will be added shortly.

4.1.logMAR Visual Acuity
All charts have been designed according to the logMAR principles proposed by Bailey and Lovie1 that are currently accepted worldwide as the gold standard for visual acuity measurement.
According to logMAR design, all charts have the following characteristics:
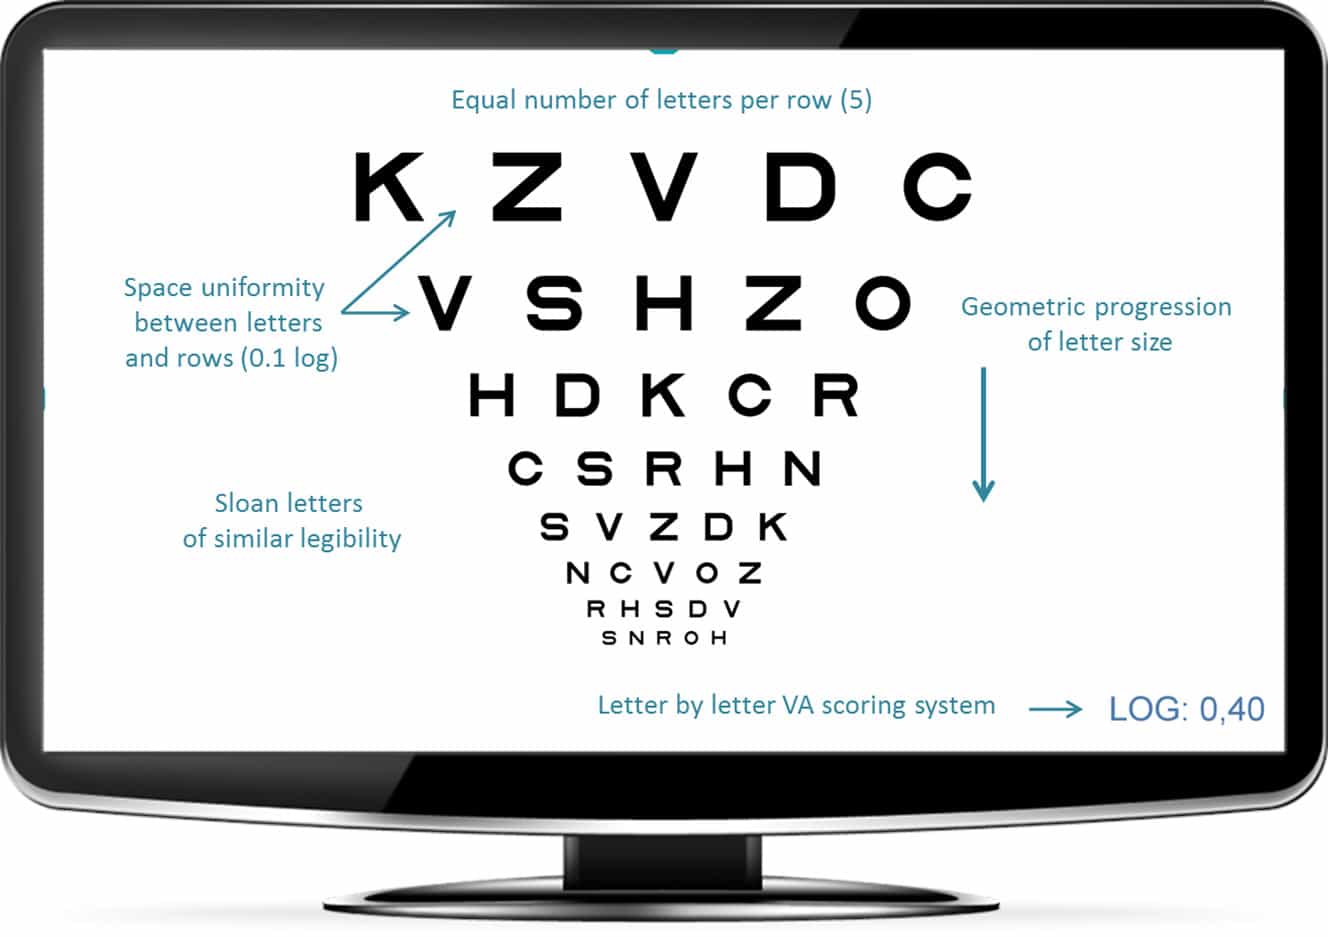
Equal numbers of targets (letters or symbols) per line: All lines have 5 targets (except low acuity values for which 5 targets cannot fit on the screen). This results in equally valid measures of acuity at all sizes as well as a more precise calculation of visual acuity (see below).
Standardized spacing between lines and letters: Letters in the same line are separated by one letter’s width and lines are spaced by the width of the letter on the smaller line.
Standardized progression of letter size between lines: The size of the letters varies by uniform steps on a logarithmic scale, changing by a factor of 1.26 from line to line. This logarithmic (proportional) size progression leads to a linear increase in recognizability according to the Weber-Fechner Law. It also guarantees that the letter sizes vary by the same ratio at high (small targets) and low (large targets) acuity values.
Contour interaction: The design we just described, with a standard separation between consecutive letters and rows, also results in a standardization of contour interaction at each level of acuity. At each level, there is consistent effect from contour interaction.
Letters of similar difficulty: Some letters are easier to identify than others. For a valid measure of visual acuity, it is very important that the letters be of equal difficulty. The letters used in each line of the chart tests have been carefully selected, so that each line has a similar global difficulty (obtained by summing all letter difficulty scores in each row). Also, even though rows may contain a different set of letters, each row is equal in difficulty to the other rows, at all levels of acuity.
The final VA value is based on the total number of letters (or symbols) that are identified correctly. The acuity value is expressed according to a logarithmic scale, in which each letter has a numerical value. This allows precise quantification, taking into account all correct and incorrect identifications, by simply adding together all the letters that were identified correctly at each level of acuity. This type of acuity determination affords greater accuracy and reliability than other methods.
Below we explain in more detail how the logarithmic notation is made.